Table Of Contents
- The Importance of Server Performance Monitoring
- Server Performance Metrics
- Requests Per Second
- Stay in the Know With PRISM ME!
The DevOps movement is gaining a lot of momentum these days, and more and more developers are jumping in to handle the entire process of delivering web applications. They're taking care of everything from deployment to monitoring performance and ensuring smooth operations.
As your app begins to gain traction among real-world users, it becomes more important for you to understand the server's role for your application. Some people choose to handle it on their own, while others seek assistance from web development agencies in Dubai, relying on the expertise of professionals.
Regardless of your chosen approach, it's vital to collect system performance metrics for the servers running your web applications. This will help you evaluate their health and optimize your web server's performance, ensuring seamless and efficient operation.
Server performance metrics are shared among various web servers, such as Apache, IIS, Azure, AWS, and NGINX, exhibiting similarities across the board. However, in this discussion, we'll primarily focus on Microsoft Azure.
It provides an intuitive interface for easily finding and collecting data. When you work with Azure, you can host your applications in either Azure App Services (PaaS) or Azure Virtual Machines (IaaS). This will give you access to various metrics related to your application or the server it runs on.
Server Performance Metrics

Requests Per Second
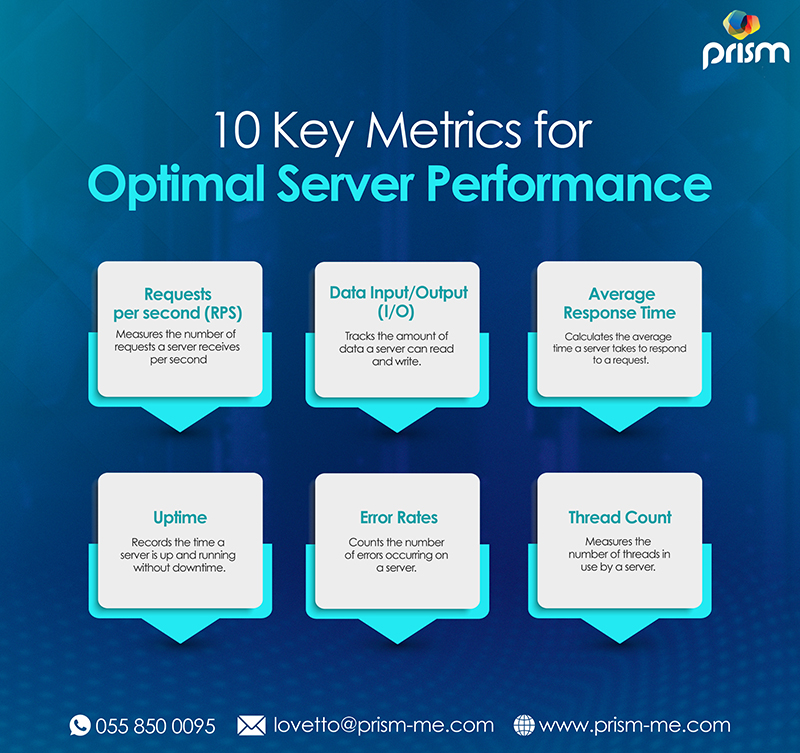
Requests Per Second (RPS) or throughput measures the number of requests your server handles in one second. It reflects the core function of a web server: receiving and processing requests. In high-scale applications, RPS can reach up to 2,000 requests per second.
Remember, when facing a heavy load, any server can struggle to keep up. It's essential to understand that requests merely capture the overall number of interactions with the server. It doesn't provide detailed information about each request.
Data I/O
When it comes to data input and output, this metric is really important. Data input indicates the size of the request payload being sent to the web server. In this case, a lower rate is preferable, which means that smaller payloads are being transmitted. A high data input rate can suggest that the application is requesting more information than necessary.
On the other hand, data output refers to the response payload sent to clients. As websites continue to grow in size, this becomes a concern, especially for users who have poor network connections.
Bloated response payloads result in slow-loading websites, ultimately delivering a subpar user experience. Excessive delays can prompt users to abandon the site and look for alternatives.
According to Google, pages taking three seconds or more to load on mobile devices have a staggering 53% chance of users giving up before the load completes.
Average Response Time
Average response time (ART) is actually the average duration it takes for the server to respond to all requests. This metric serves as a strong indicator of the overall application performance and offers insights into its usability.
Typically, a lower value is desired, indicating faster response times. However, studies reveal that for users to perceive a sense of "seamlessness" while navigating an application, the response time ceiling is around one second.
When assessing ART, it's important to keep in mind its nature as an average. Like any average, unusually high values can skew the number and create the perception of slower performance than it actually is. ART is most effective when considered alongside our next metric on the list.
Peak Response Time
Just like the average response time, the peak response time (PRT) captures the longest duration among all the responses to incoming requests managed by the server. This metric provides valuable insights into performance pain points within the application.
It's worth noting that once the response time exceeds 10 seconds, user frustration tends to escalate significantly.
Monitoring PRT not only helps identify areas of the application that are causing bottlenecks but also assists in pinpointing the underlying reasons for these delays. For instance, if a particular web page or function call is consistently slow, this metric can guide you toward the problematic areas that require attention.
Hardware Utilization
Now, let's discuss hardware. Every running application or server operates within the confines of allocated resources. So, it is crucial to monitor resource utilization to identify potential bottlenecks. Three key aspects of a server to consider are:
- The processor
- The RAM (memory)
- The disk space and usage
When assessing these components, your goal is to identify potential bottlenecks that can impact the overall system performance. As any computer running with these components will demonstrate, performance is only as strong as its weakest link. This metric allows you to identify the bottleneck and decide which physical components can be upgraded to enhance performance.
Let's take an example: imagine you're facing difficulties in rendering data from a physical hard drive. This can create a bottleneck in the input/output (I/O) interactions between fetching files and displaying them to the user.
While the hard drive is busy spinning and fetching data, other physical components remain idle. Upgrading to a solid-state drive would eliminate the bottleneck and enhance overall application performance.
Thread Count
The thread count of a server shows how many simultaneous requests are happening at a given time. It gives you an idea about the overall server load at the request level and helps assess the impact of running multiple threads.
Servers can be configured with a maximum thread count, setting a limit on concurrent requests. If the thread count exceeds this limit, additional requests are deferred until there's space in the processing queue.
If deferred requests take too long, they may time out. Increasing the max thread count relies on having sufficient resources available.
Disk Usage
Monitoring disk usage is crucial for assessing performance. It reveals storage space utilization and helps identify potential issues or bottlenecks. This metric includes factors like used disk space, read and write operations, processing time for requests, data transfer capacity, and pending I/O operations.
Monitoring disk usage plays a vital role in allowing system administrators to identify any performance issues related to the disk. It enables them to optimize storage utilization and ensure seamless server operations.
Load
Server load is one of the most important metrics that shows resource utilization and performance. This metric calculates the average count of active processes or threads, as well as those waiting for CPU time, within a specific time frame.
Server load takes into account factors like workload, hardware specifications, and the impact of load on performance. Monitoring server load helps understand resource demands, identify potential bottlenecks, and optimize system performance.
Network bandwidth
Monitoring network bandwidth is essential for maintaining high-performance server networks. It measures bandwidth utilization, throughput and potential bottlenecks.
It helps in the proactive optimization of network performance, seamless data transmission and efficient user experience. Monitoring network bandwidth helps identify and resolve issues that can hinder network performance in a timely manner.
Uptime
While not directly tied to performance, server uptime is an essential metric. It represents the percentage of time the server is available for use. Ideally, you aim for 100% uptime, and many web hosting packages offer 99.9% uptime or higher.
It's common for software projects to stick to a service level agreement that defines a specific uptime rate. If your server doesn't provide built-in uptime metrics, there are reliable third-party services available to monitor it for you.
HTTP Server Error Rate
The HTTP server error rate is an important performance metric, although it doesn't directly measure application performance. It indicates the count of internal server errors or HTTP 5xx codes returned to clients.
These errors take place when applications encounter unhandled exceptions or other errors. Setting up alerts for these errors is a good practice, as 500 errors are typically preventable. Being promptly notified of all HTTP server errors helps you stay proactive in resolving issues and prevent error accumulation over time.
Stay in the Know With PRISM ME!
To stay on top of things, it's crucial to track these key server performance metrics.
If you haven't already, give these metrics a shot. They're the best way to keep a close eye on your server's performance and your application's overall health.
When it comes to optimizing your server performance, PRISM ME can be your go-to solution. As one of the leading web design companies in Dubai, we offer top-notch web development services that are hard to beat.
With PRISM ME by your side, you can trust our expertise to enhance your server's efficiency and overall performance. Contact us today to take your application to new heights!

About The Author: Lovetto Nazareth
Lovetto Nazareth, owner of Prism Digital, brings over two decades of experience in advertising and digital marketing. Renowned for managing countless successful campaigns, he has generated millions in new leads. An avid adventure sports enthusiast and singer-songwriter, follow his diverse pursuits on social media @LovettoNazareth.


